Northeast Pending Home Sales Rose 3% in June
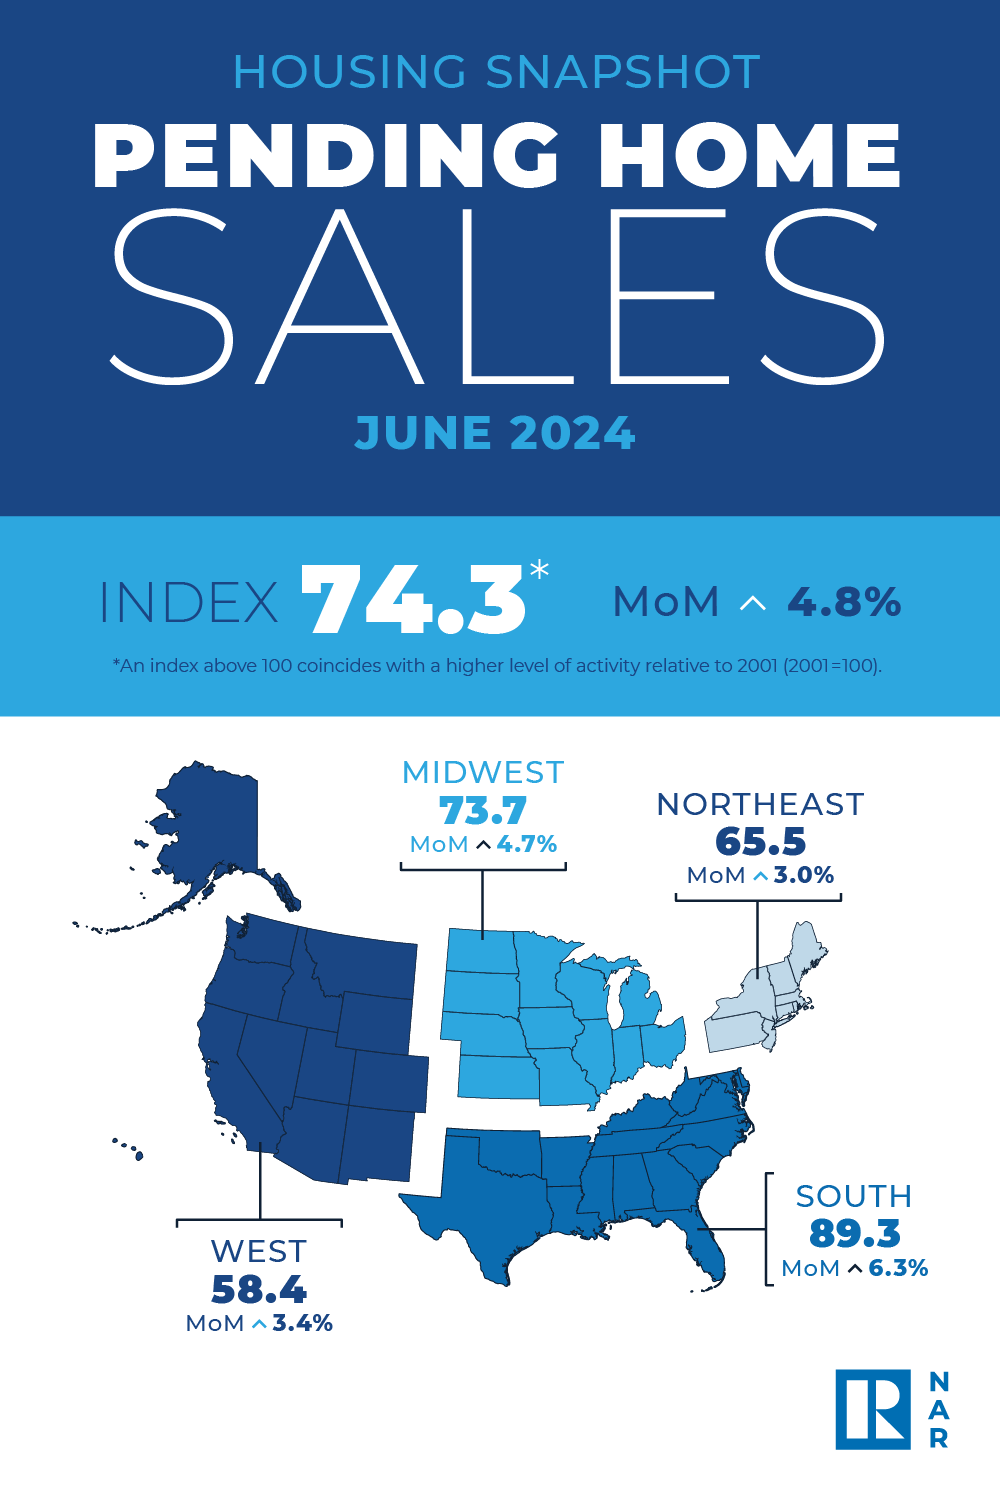
WASHINGTON—Pending home sales in June increased 4.8%, according to data released today (July 31) by the National Association of Realtors. All four U.S. regions posted monthly gains in transactions. Year-over-year, the Northeast, Midwest and South registered declines, while the West increased.
The Pending Home Sales Index—a forward-looking indicator of home sales based on contract signings—grew to 74.3 in June. Year-over-year, pending transactions were down 2.6%. An index of 100 is equal to the level of contract activity in 2001.
“The rise in housing inventory is beginning to lead to more contract signings,” said NAR Chief Economist Lawrence Yun. “Multiple offers are less intense, and buyers are in a more favorable position.”
Pending Home Sales Regional Breakdown
The Northeast PHSI rose 3.0% from last month to 65.5, a decline of 0.3% from June 2023. The Midwest index increased 4.7% to 73.7 in June, down 4.2% from one year ago.
The South PHSI increased 6.3% to 89.3 in June, dropping 3.9% from the prior year. The West index climbed 3.4% in June to 58.4, up 1.0% from June 2023.
"Even more inventory is expected to come onto the housing market in the upcoming months ahead of the normal, seasonal declines in the winter," added Yun. "The Northeast's small gain in contract signings is due to the ongoing housing shortage situation in that region, leading to stronger home price gains. It is a good time to list."
Pending contracts are good early indicators of upcoming sales closings. However, the amount of time between pending contracts and completed sales is not identical for all home sales. Variations in the length of the process from pending contract to closed sale can be caused by issues such as buyer difficulties with obtaining mortgage financing, home inspection problems, or appraisal issues.
The index is based on a sample that covers about 40% of multiple listing service data each month. In developing the model for the index, it was demonstrated that the level of monthly sales-contract activity parallels the level of closed existing-home sales in the following two months.
An index of 100 is equal to the average level of contract activity during 2001, which was the first year to be examined. By coincidence, the volume of existing-home sales in 2001 fell within the range of 5.0 to 5.5 million, which is considered normal for the current U.S. population, NAR officials stated.